Commercial cannabis cultivation produces enormous amounts of data.
Temperature. Humidity. VPD. CO₂. Feed EC. Runoff EC. Irrigation volume. Labor hours. Harvest weight. Trim loss. Cycle time.
The problem isn’t collecting the data.
The problem is turning that data into a useful measure of performance.
A cultivation KPI should do more than report a number. It should help answer a management question:
- Is this room performing better or worse than it did last cycle?
- Are we hitting the production targets we’ve established?
- Are environmental conditions being executed consistently?
- Are we getting enough production from the canopy we’re operating?
- Are cycles taking longer than they should?
- Is a problem isolated to one room, strain, or cycle—or is it becoming a facility-wide trend?
This guide explains the cannabis cultivation KPIs that matter, how they fit together, and why a KPI without a defined performance standard can be little more than another number on a spreadsheet.
What Is a Cannabis Cultivation KPI?
A key performance indicator (KPI) is a measurable value used to evaluate how effectively an operation is achieving a defined objective.
In commercial cannabis cultivation, KPIs can measure several different dimensions of performance:
- Production — Yield density, dry weight, yield per light
- Cycle performance — Cycle time, harvest timing, turns per year
- Environmental execution — Temperature, RH, VPD, CO₂
- Irrigation — Feed EC/pH, runoff EC/pH, irrigation consistency
- Crop performance — Survival %, consistency, crop loss
- Labor — Labor hours, labor per pound
- Post-harvest — Wet-to-dry ratio, trim/waste, drying consistency
- Financial — Cost per gram, revenue per square foot
But there is an important distinction between measuring something and managing it as a KPI.
A metric becomes useful when you know what you’re comparing it against.
The Most Important Cannabis Cultivation KPIs
There isn’t one universal list of KPIs that every facility should use.
A small operation, a large indoor facility, and a multi-site operator may have very different priorities.
The most useful approach is to look at cultivation KPIs in layers.
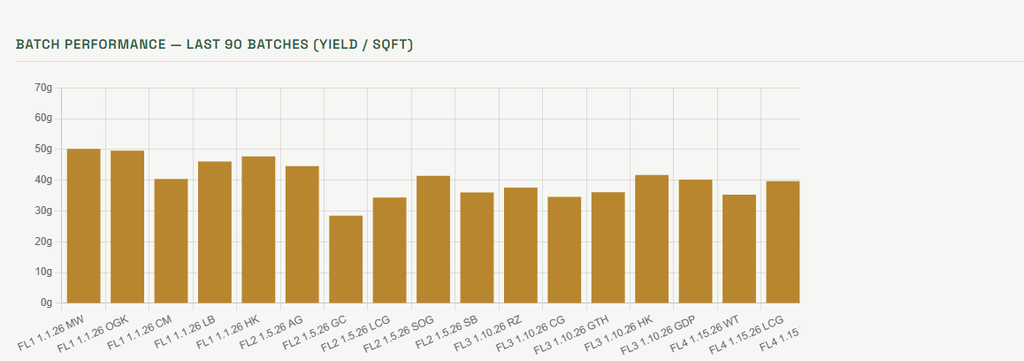
Yield Density
Yield density measures dry production relative to the canopy area used to produce it.
Formula:
Dry harvest weight ÷ productive canopy area
Yield density is useful because it normalizes production for the amount of growing space being used.
But yield alone doesn’t tell the whole story.
A room producing more grams per square foot isn’t necessarily performing better if:
- it takes significantly longer to finish;
- the crop has a higher loss rate;
- product quality declines;
- processing losses increase; or
- the room sits empty between cycles.
That’s why yield should be evaluated alongside cycle time and other production metrics.
Yield Per Light
Yield per light is another common production metric:
Formula:
Total dry harvest weight ÷ number of production lights
It can be useful for comparing rooms using similar lighting configurations.
However, it should be defined consistently. Comparing rooms with substantially different lighting technology, fixture density, genetics, or production methods can produce misleading conclusions.
Dry Harvest Weight
Total dry weight remains an important production measure.
But total pounds or kilograms by themselves can be misleading when comparing rooms of different sizes.
A larger room producing more weight isn’t necessarily more productive.
That is why normalized metrics such as yield density are valuable alongside total production.
Cycle Time
Cycle time measures how long it takes to move a crop through the production process.
Depending on how a facility defines its production cycle, this might include propagation, vegetative growth and flowering through harvest.
The important part is consistency:
Define the start and end points the same way every cycle.
Cycle time matters because production capacity isn’t determined only by how much a room produces.
It is also determined by how many times that room can produce during the year.
A room that produces slightly less per harvest but consistently completes additional cycles may generate more annual production than a room chasing maximum yield on every individual harvest.
Harvests Per Room Per Year
This metric connects cycle time to annual production capacity.
A simplified calculation is:
365 ÷ total days required per production cycle
In practice, the calculation should account for the facility’s actual scheduling structure and room turnaround time.
That makes room rotation and downtime important operational measurements—not just administrative scheduling details.
Environmental Performance KPIs

Environmental readings are among the most frequently collected measurements in commercial cultivation.
But collecting thousands of temperature, RH, VPD and CO₂ readings doesn’t automatically tell management whether the room performed well.
The useful question is:
How consistently did the room execute the environmental conditions we intended to run?
Environmental Stability
Environmental Stability can measure the percentage of readings that remain within the acceptable range established by the facility.
Formula:
Readings within acceptable range ÷ total readings × 100
This turns thousands of individual sensor readings into a performance measurement that management can actually compare.
Target Execution
A facility may also want to distinguish between acceptable performance and target performance.
A room can remain technically within its acceptable range while spending relatively little time near the target.
Those are different outcomes.
That’s why CannaKPI uses separate Min / Target / Max bands defined by the grower for each metric and flower week.
Irrigation and Root-Zone KPIs
Depending on the production system, facilities may track:
- Feed EC
- Feed pH
- Runoff EC
- Runoff pH
- Irrigation volume
- Irrigation frequency
- Dryback behavior
- Runoff percentage
Again, the raw number isn’t necessarily the KPI.
The useful measurement is whether the facility consistently executed the irrigation strategy it intended to execute.
This becomes particularly important when production methods deliberately change targets throughout the flower cycle.
CannaKPI allows growers to define different Min/Target/Max bands by flower week, which means the performance standard can change as the crop moves through the cycle rather than forcing one static target across the entire flower period.
Crop Performance KPIs
Plant Survival %
Plant survival measures the percentage of plants that make it through the production cycle.
It is simple, but important.
A facility that produces an excellent yield from surviving plants may still have an operational problem if significant plant loss occurred along the way.
Consistency Between Cycles
This is one of the most overlooked measurements in cultivation.
A facility doesn’t become operationally excellent by having one exceptional harvest.
The question is:
Can it repeat the result?
That means comparing performance across:
- rooms;
- strains;
- batches;
- cycles;
- seasons; and
- cultivation teams.
The trend can be more valuable than the individual result.
Post-Harvest KPIs
Cultivation performance doesn’t end when plants are harvested.
Useful post-harvest measurements include:
Wet-to-Dry Ratio
Comparing wet harvest weight to final dry weight helps establish whether drying outcomes are consistent.
Trim/Waste
Tracking trim and waste helps distinguish total biological production from usable product.
Drying Consistency
A facility can compare wet-to-dry ratios against its own historical range and flag unusual results.
This is particularly useful because a single abnormal result may warrant investigation even when the absolute number doesn’t violate a predetermined rule.
Labor KPIs
Cultivation labor can be measured in several ways:
- Total labor hours
- Labor hours per pound
- Labor hours per batch
- Harvest labor
- Trim labor
- Production output per labor hour
The most useful metric depends on the decision being made.
For example:
Total labor hours tells you how much labor was consumed.
Whereas:
Labor hours per pound tells you something about production efficiency.
That distinction matters when comparing cycles of different sizes.
Financial and Management KPIs
Eventually, cultivation performance has to translate into business performance.
Management may care about:
- Cost per gram
- Cost per pound
- Revenue per square foot
- Production cost
- Labor cost
- Waste
- Production volume
- Cycle throughput
The most important metrics depend on the questions management needs answered.
A cultivation manager may look at environmental execution while an owner may ask why a facility produced less sellable product this quarter.
The underlying data can be the same.
The KPI presentation needs to answer the question being asked.
Why a KPI Without a Target Isn’t Enough
Consider a room that produces:
55 g/ft²
Is that good?
There isn’t enough information to know.
Suppose:
- The facility’s target is 50 g/ft²
- The previous cycle produced 47 g/ft²
- Cycle time improved by six days
- Survival increased
- Environmental execution improved
That 55 g/ft² result may represent a meaningful improvement.
Now consider another room producing the same:
55 g/ft²
But its target is 70 g/ft² and the previous cycle produced 64 g/ft².
Same number.
Completely different performance.
This is why CannaKPI is built around a fundamental principle:
Performance should be measured against the standards established by the facility—not against an algorithm’s opinion of what “good” looks like.
CannaKPI allows growers to define Min / Target / Max bands for tracked environmental metrics and then calculates how consistently actual readings fall within those bands.
KPI vs. Benchmark: They Aren’t the Same Thing
Industry benchmarks can be useful.
They can provide context when a facility is establishing its initial expectations.
But a benchmark isn’t automatically the correct operating target for every facility.
Cultivars, lighting systems, room design, production methodology, market positioning and operating procedures can all influence performance.
The more useful long-term comparison is often:
This cycle vs. our previous cycles.
That is where historical facility data becomes valuable.
Instead of asking:
“Are we hitting somebody else’s benchmark?”
Management can ask:
“Are we improving against our own established standard?”
The KPI Dashboard Should Answer Questions—Not Just Display Data
A dashboard can contain hundreds of numbers and still be useless.
The best management dashboard answers a relatively small number of questions quickly.
How are we performing?
Cycle Performance
Are we executing the environment?
Environmental Stability
Are we hitting our intended targets?
Target Execution
Are we producing efficiently?
Yield Density
Are we keeping production moving?
Cycle Time / Turns Per Year
Are we losing product?
Survival / Waste / Drying Consistency
Which cycle needs attention?
Cycle comparison and trend analysis
CannaKPI’s management dashboard is designed around this distinction: management gets the current performance picture first, while deeper investigation happens in Cycle Monitor and Batch Comparison.
The Most Important KPI May Be Consistency
A single exceptional harvest can make a facility look great.
A consistent operation is much harder to achieve.
For management, the important question isn’t necessarily:
“What was our best harvest?”
It is:
“Can we repeatedly produce the result we expect?”
That requires looking at performance over multiple cycles.
CannaKPI’s Cycle Monitor and Management Dashboard are designed around this type of comparison—looking across cycles, identifying weaker metrics, and examining trends rather than relying on a single data point.
What Should a Cannabis Cultivation KPI System Actually Do?
At minimum, a useful system should allow a facility to:
- Define its own performance standards
- Collect the underlying operational data
- Measure actual performance against those standards
- Compare rooms and cycles
- Identify trends
- Flag meaningful deviations
- Connect production results to environmental and operational execution
- Give management a clear picture without requiring someone to manually analyze spreadsheets
That’s the difference between data collection and performance management.
How CannaKPI Approaches Cultivation KPIs

CannaKPI is a cultivation intelligence platform for commercial cannabis facilities.
Rather than replacing the grower’s standards with generic assumptions, CannaKPI lets the facility define its own targets and scores actual performance against those standards.
The platform combines:
- Environmental targets
- Daily cultivation data
- CSV imports from existing systems
- Cycle monitoring
- Harvest data
- Batch tracking
- Performance trends
- Management-level reporting
CannaKPI’s Smart Import feature can map CSV exports from existing environmental or irrigation systems, allowing facilities to use the data they’re already collecting without replacing their existing hardware.
The result is a system designed to answer a straightforward question:
How well did we actually execute this cycle—and what does the data suggest we should investigate?
Frequently Asked Questions
What are the most important KPIs in cannabis cultivation?
Important cultivation KPIs can include yield density, cycle time, harvests per room per year, environmental stability, target execution, survival, labor efficiency, post-harvest consistency and cost per gram. The appropriate KPI set depends on the facility and the decisions management needs to make.
What is a good cannabis yield per square foot?
There isn’t one universal number that should be treated as the correct target for every facility. Yield depends on genetics, lighting, canopy configuration, production methodology and other operating conditions. A facility’s historical performance and defined targets can provide a more useful comparison.
What is the difference between a KPI and a cultivation metric?
A metric simply measures something. A KPI is a metric that has been selected because it helps evaluate performance against an important objective.
Should cannabis cultivation KPIs be compared against industry benchmarks?
Industry benchmarks can provide useful context, particularly when establishing initial targets. Long-term performance management is often more useful when a facility also compares current results against its own historical performance and defined standards.
How often should cultivation KPIs be reviewed?
The appropriate frequency depends on the KPI. Environmental execution may need daily visibility, while cycle performance and production metrics become more meaningful when reviewed across completed cycles
Can cultivation KPIs be tracked without replacing existing sensors?
Yes. CannaKPI is designed to work with existing systems through manual entry and CSV imports. Its Smart Import feature maps existing exports into CannaKPI fields without requiring a specific sensor vendor.
Measure What Your Operation Actually Does
The goal of cultivation data isn’t to create another dashboard full of numbers.
It’s to understand whether the operation is executing the way it is supposed to—and whether that execution is improving over time.
Your standards. Your data. Your performance.
CannaKPI turns cultivation data into measurable performance.